Energetic Center FENIX Jeseník

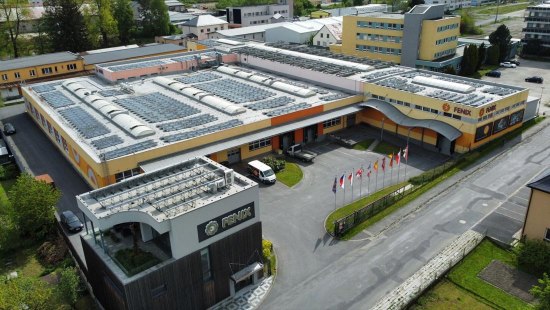
The production area of FENIX s.r.o. ensures, within the FENIX GROUP a.s. group, especially the production of the ECOFLOOR range of heating cables, ECOSUN radiant panels, and now also HES and MES battery storage systems. All production, storage, and office spaces are heated exclusively by electric radiant heating. The reserved power is negotiated within the range of 600-750 kW throughout the year. The average electricity consumption of the entire area is approximately 3 GWh per year.
Building the EC FENIX - photovoltaics and battery storage
A new Energy Center was built in the production area of FENIX s.r.o. in Jeseník between 2022 and 2023. The aim of the project was to ensure a higher level of energy self-sufficiency and reduce operating costs during the energy crisis. In the autumn of 2022, the installation of new photovoltaic power plants began. The original installed capacity of approximately 130 kWp was gradually increased to the current 891 kWp in this stage - the installation took place on free roofs, but also on building walls or ground structures.
In January 2023, a new SAS battery storage system with a total capacity of 2.4 MWh and a power output of 720 kW was also launched. The equipment is installed in two shipping containers and is directly connected to the substation at the entrance to the area. This new storage complements the original solution with a capacity of just under 600 kWh and a power output of 720 kW from 2019, which is installed in the technical room of one of the production buildings and primarily provides energy backup for the area, protection against micro-outages, and trimming of consumption peaks. The total capacity within the battery storage systems thus currently amounts to almost 3 MWh. The system was designed with the aim of maximizing the use of self-generated energy directly in the area in connection with automatic optimization of electricity purchase and supply within the spot market.
Practical operation of the system
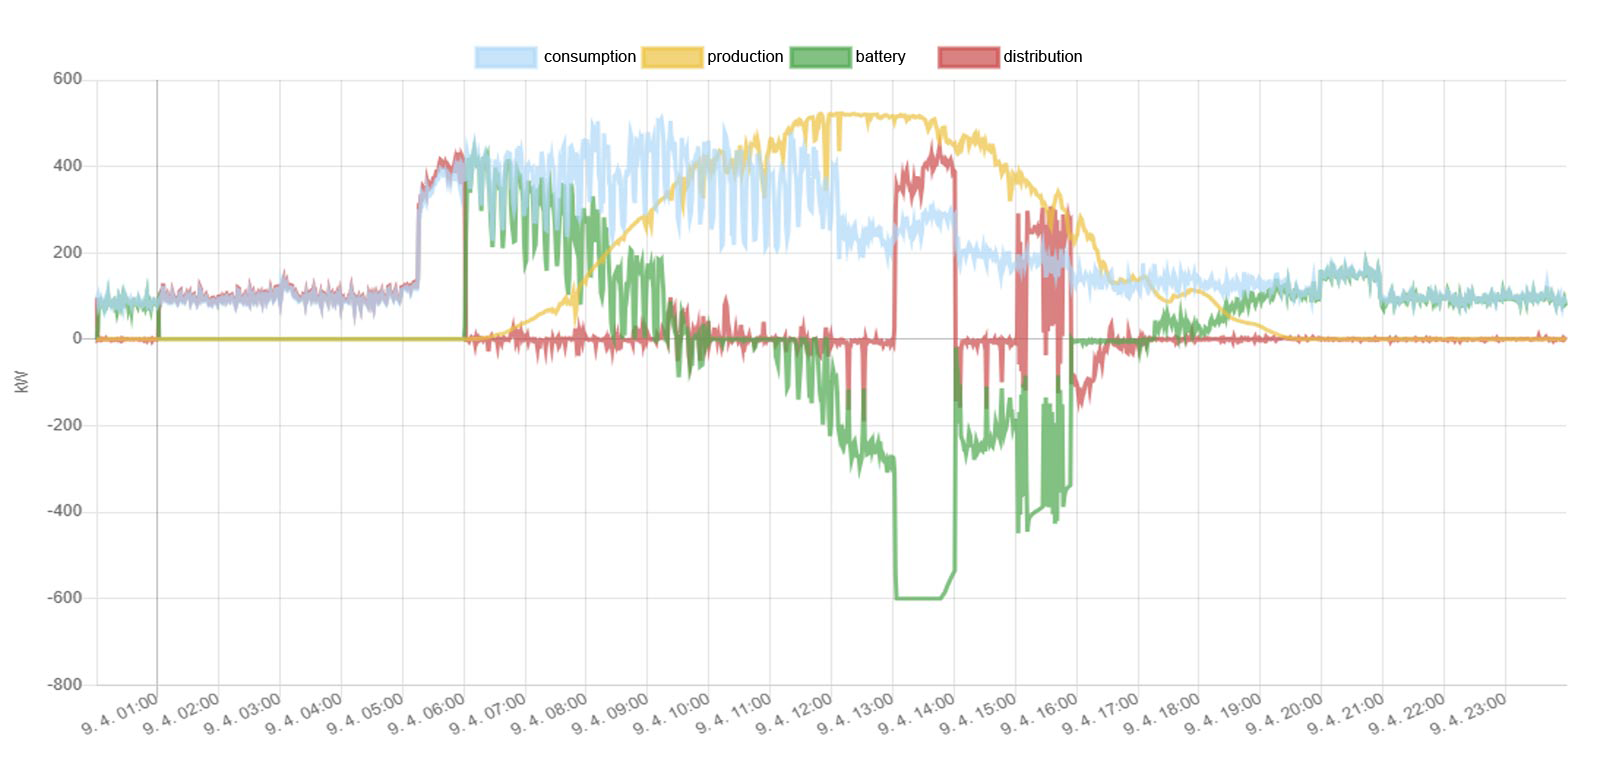
The FENIX Energy Center is managed by a control system that ensures monitoring of current consumption and PV production. At the same time, so-called spot hourly prices for power electricity are always loaded for the following day, and the sunlight forecast is evaluated - based on this information, the algorithm then generates a behavior plan that determines the times when the battery storage will be charged from the grid or from PV surpluses, when the battery will compensate for the area's consumption, thus reducing the consumption from the distribution network, and when, on the contrary, the battery storage will supply excess energy to the grid at a favorable price. The entire process is automated and does not require manual intervention.

Operational results for 2023
| Period | Total consumption (kWh) |
Grid consumption (kWh) |
PV production (kWh) |
Supply to grid (kWh) |
Grid consumption (CZK) |
Distribution payments (CZK) |
Supply to grid (CZK) |
Electricity costs (CZK) |
Achieved price (CZK/kWh) |
|---|---|---|---|---|---|---|---|---|---|
| 01/2023 | 329 000 | 318 432 | 11 000 | 423 | 1 114 069 | 194 619 | 132 | 1 308 556 | 3,98 |
| 02/2023 | 270 050 | 254 054 | 16 040 | 46 | 888 806 | 177 619 | 78 | 1 066 347 | 3,95 |
| 03/2023 | 252 116 | 215 497 | 39 951 | 3 332 | 616 351 | 168 867 | 3 491 | 781 727 | 3,10 |
| 04/2023 | 194 526 | 158 590 | 43 360 | 7 424 | 442 055 | 148 101 | 5 527 | 584 629 | 3,01 |
| 05/2023 | 174 248 | 118 668 | 71 226 | 15 646 | 272 752 | 140 232 | 15 418 | 397 566 | 3,01 |
| 06/2023 | 150 822 | 83 735 | 81 889 | 14 802 | 214 833 | 133 338 | 20 810 | 327 361 | 2,17 |
| 07/2023 | 101 738 | 48 461 | 93 084 | 39 807 | 120 738 | 126 416 | 59 977 | 187 177 | 1,84 |
| 08/2023 | 160 843 | 101 412 | 72 590 | 13 159 | 228 809 | 136 819 | 20 159 | 345 469 | 2,15 |
| 09/2023 | 133 953 | 72 642 | 78 246 | 16 935 | 192 244 | 131 140 | 30 406 | 292 978 | 2,19 |
| 10/2023 | 154 912 | 113 788 | 46 592 | 5 468 | 296 116 | 139 258 | 7 379 | 427 995 | 2,76 |
| 11/2023 | 191 674 | 177 704 | 14 400 | 430 | 444 890 | 178 018 | 489 | 622 419 | 3,25 |
| 12/2023 | 185 807 | 177 997 | 8 510 | 700 | 423 600 | 174 639 | 268 | 597 971 | 3,22 |
| Total | 2 299 689 | 1 840 980 | 576 888 | 118 172 | 5 255 263 | 1 849 066 | 164 134 | 6 940 195 | 3,00 |
Without investing in the Energy Center (PV, storage, active SPOT), electricity costs would reach approximately CZK 14 million without VAT (with a consumption of 2.3 GWh and the government capped price of power electricity).
Investment costs in the Energy Center (after deducting the subsidy of CZK 11.5 million) amounted to CZK 45.5 million without VAT. For 2023, the annual savings amount to approximately CZK 7 million, so the current payback period is 6.5 years.
Operational results for 2024
| Period | Total consumption (kWh) |
Grid consumption (kWh) |
PV production (kWh) |
Supply to grid (kWh) |
Grid consumption (CZK) |
Distribution payments (CZK) |
Supply to grid (CZK) |
Electricity costs (CZK) |
Achieved price (CZK/kWh) |
|---|---|---|---|---|---|---|---|---|---|
| 01/2024 | 267 261 | 256 519 | 10 922 | 180 | 580 004 | 415 675 | 150 | 995 529 | 3,72 |
| 02/2024 | 211 685 | 184 154 | 29 654 | 2 123 | 341 023 | 327 739 | 1 800 | 666 962 | 3,15 |
| 03/2024 | 184 309 | 132 441 | 56 128 | 4 260 | 241 376 | 267 965 | 4 582 | 504 759 | 2,73 |
| 04/2024 | 143 484 | 84 087 | 73 023 | 13 626 | 161 001 | 213 425 | 14 576 | 359 850 | 2,51 |
| 05/2024 | 109 714 | 53 323 | 75 449 | 19 058 | 90 512 | 196 958 | 27 922 | 259 548 | 2,36 |
| 06/2024 | 120 174 | 61 110 | 75 151 | 16 087 | 123 040 | 205 037 | 22 856 | 305 221 | 2,53 |
| 07/2024 | 112 203 | 50 779 | 82 021 | 20 597 | 93 736 | 194 341 | 30 997 | 257 080 | 2,29 |
| 08/2024 | 97 351 | 52 063 | 82 048 | 36 760 | 114 432 | 184 681 | 98 562 | 200 551 | 2,06 |
| 09/2024 * | 100 083 | 71 494 | 38 700 | 10 111 | 137 260 | 202 089 | 16 488 | 322 861 | 3,23 |
| 10/2024 | 221 841 | 217 504 | 41 762 | 37 425 | 503 539 | 332 912 | 88 437 | 748 014 | 3,37 |
| 11/2024 | 272 446 | 247 566 | 24 983 | 103 | 821 258 | 376 742 | 224 | 1 197 776 | 4,39 |
| 12/2024 | 238 894 | 225 515 | 13 908 | 529 | 776 532 | 351 310 | 1 024 | 1 126 818 | 4,71 |
| Celkom | 2 079 445 | 1 636 555 | 603 749 | 160 859 | 3 983 713 | 3 268 874 | 307 618 | 6 944 969 | 3,34 |
* In September 2024, the data was affected by a high-voltage connection failure due to flooding, with some values distorted by communication outages. Power supply restoration from the grid was completed only after 12 days.
Prices are listed without VAT
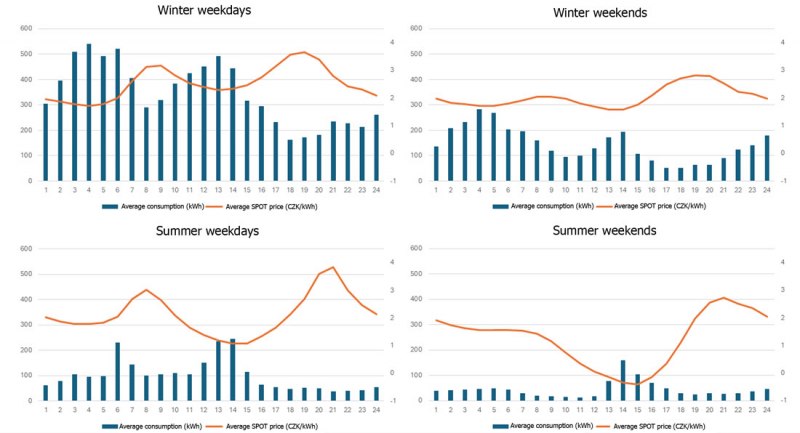
Examples of daily load profiles on weekdays and weekends during the winter (Jan, Feb, Mar, Oct, Nov, Dec) and summer (Apr, May, Jun, Jul, Aug, Sep) periods of 2024. The graphs depict the average hourly consumption in kWh and the average spot price of electricity.


